Data Analysis Workflow Guide
Introduction
I have compiled a list of good data analysis workflow tips from Professor Roger Peng’s Analytic Mind, ep2. where he did a live data analysis on an air pollution dataset. The dataset contains the chemical composition of the air from both normal days and wild fire days.
Roger Peng is a Professor in the Department of Biostatistics at the John Hopkins Bloomberg School of Public Health. He is also teaching the Data Science Specialization and Computing for Data Analysis course on Coursera.
1. Updating packages and R startup script
Peng started off the analysis with checking for R updates. I am not sure that this is necessary for every R session, but it is important to update your packages regularly. If you are trying to make reproducible work, you should also log your package updates. Below is the command he used,
update.packages(ask=F)
Another tip is to set up an R startup script. There are many cool things you could automate such as loading the tidyverse library and setting stringAsFactor to false.
To make a startup file, you need to create a file called .Rprofile, write in your desired startup commands, then move the file to one of the following
- your work directory
- HOME directory
- R’s installation directory
Upon starting up, R looks for a .Rprofile file in the listed order above and only runs the first .Rprofile file it finds.
Details of setting the Rstartup script up can be found at EfficientR. You can also find lots of other advanced R tips from the website. Additionally, you should also check out this Rblogger Post to find an extensive list of useful R startup commands.
2. Looking at the data, at least the summary
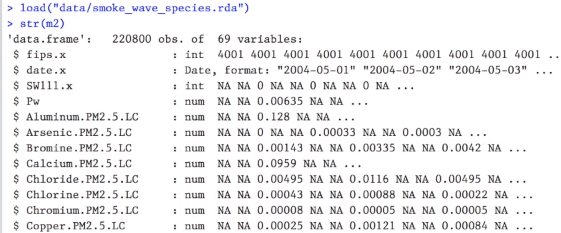
Reading off some summary statistics for each column could help a lot. Peng used the function str to get an overview of the data right after he loaded it.

The str function provides you information about the datatable’s dimensions, column names, column data types, and the first five entries of each column.
Another important thing to look for during EDA is data sparsity, the amount of “NA”s or 0s in the data. A high percentage of “NA”s or 0s will have significant impact on the data’s explanatory power and how well a model could learn from the data.
3. Renaming and reformatting
Renaming column names
If not strictly prohibited, you may want to rename your column names so that they are simpler and more understandable. One of the reasons is that you will be typing some columns names a lot during your data analysis process.
From the previous image about Roger Peng’s dataset, some column names have duplicate suffixes, such as “.x” from columns “fips.x”, “date.x” and “SW111.x”, and “.PM2.5.LC” from the “Aluminum.PM2.5.LC” and “Calcium.PM2.5.LC”
Renaming things in general (refactoring)
In his analysis, Peng renamed the dataset “smoke” to “wildfire” because the dataset has columns “smoke” and “nonsmoke” so he doesn’t want to write operations like “smoke$smoke” and “smoke$nonsmoke”. It is very important that your namings make sense and don’t conflict with others. It is especially important when you have to present and share your codes with others.
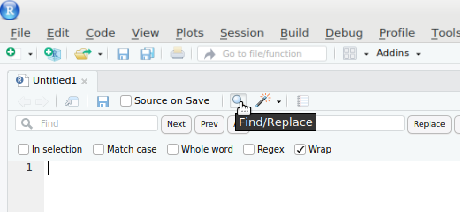
If you want to refactor a variable globally you could use the find_and_replace feature in Rstudio.

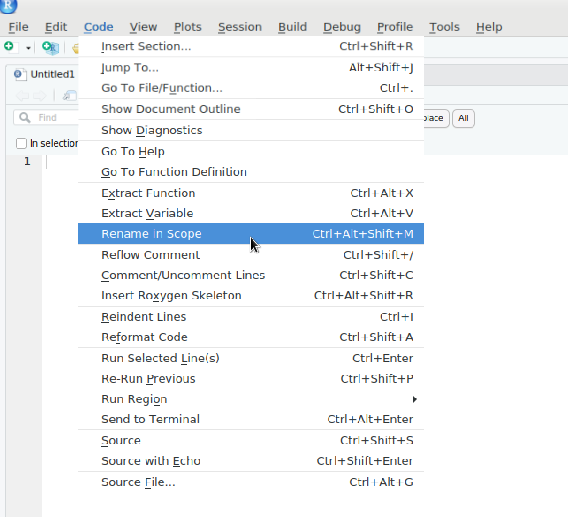
If you want to refactor a variable in a single R code chunk, you can use the “Rename in Scope” option in the top-left toolbar of Rstudio.

Reformatting
When you use str function, keep an eye on the format of variables like “date”, check the formats and time zone, and “id code”. You may want to make every entry have the same number of digits even with a 0 in front.
4. Don’t load the whole package if you only use one function to avoid conflict
To avoid duplicate function names with “dplyr”, Peng only imported the individual functions he needed from the package “dr.” Below is an example of how to import the function “filter” from “dplyr”(The dplyr::filter selects rows from a data frame that satisfies some condition while the default “filter” function in R applies a linear filter to a vector).

5. Double checking if the model is working properly
Sometimes a model’s output may give you the wrong information. For instance, if you forget to normalize your data, some models will have drastically different outputs. So, double and triple check your code. For example, make sure you don’t write the “+” as “-“. Doing unit testing before computing the model or training your data is also a great programming practice.
In Roger Peng’s analysis, after he made a Sliced inverse regression model(SIR), he double-checked the SIR model’s result by comparing it with the result from an LDA model (conceptually the same but implemented with different R packages).
6. Get familar with your data analysis tools
Being proficient with your analysis tools is just as important as your stats knowledge and problem solving skills. At least you don’t want to let writing code and debugging slow down or interupt the flow of your analysis.
In Roger Peng’s video, I was surprised how smoothly he wrote the codes for manipulating data, making plots, and building models. Compared to him, I often have to spend a good amount of time searching for code online to do my analysis. And a good portion of the time could have been saved if I have know R (especially ggplot2 and tidyverse) better.
I hope that you learned one or two new things about R after reading this post and are able to apply them to make your data analysis workflow slightly more efficient. If you are interested in learning more about R, you could go to AdvancedR and efficientR.