Datascience Beyond an Ipython Notebook
Often in a data competition, participants are only the given dataset(s) as input, and try to output some predictions, classifications or analysis. In a real organization, doing data science also involves challenges outside of doing data analysis. In this blog post, I will present the obstacles I faced when I tried to forecast a computer lab’s desktop usage (which I defined as the number of computers in use every minute during open hours) before I even loaded the correct data on my sweet iPython Notebook.
Introduction:
I am part of the volunteer staff for the Open Computing Facility (OCF) at the University of California, Berkeley, where we provide free computer access to all students.
One project I tried to work on was to forecast our desktop usage so returning student can have a basic idea when the lab is busy.
Challenge 1: The data doesn’t exist.
Ideally we want to have a table that shows how many desktops are in use at the beginning of each minute. Instead, we have data for each desktop login session. Below is a snippet of the session database whose field “host” represents desktops.
We already have code to compute desktop usage from the session data, which is used in generating a lab utilization graph on our website (see figure below), but the data was not accurate. 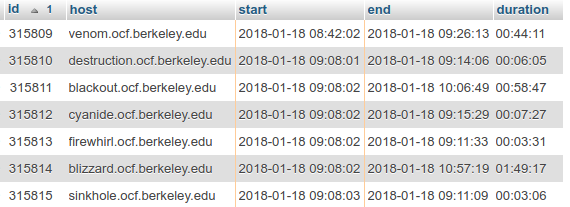
Challenge 2: The data is not accurate
From my observations, the lab was often full during the afternoon many times but lab utilization graph hardly reached the maximum on any given day.
First, I asked a senior volunteer lab staff on Slack how the data was generated, he directed me to the corresponding place in the OCF codebase and told me the session data was not accurate: all the sessions’ start times were mysteriously starting around the first 4 seconds of the minute. (check figure below) The data was like that for quite a few months. 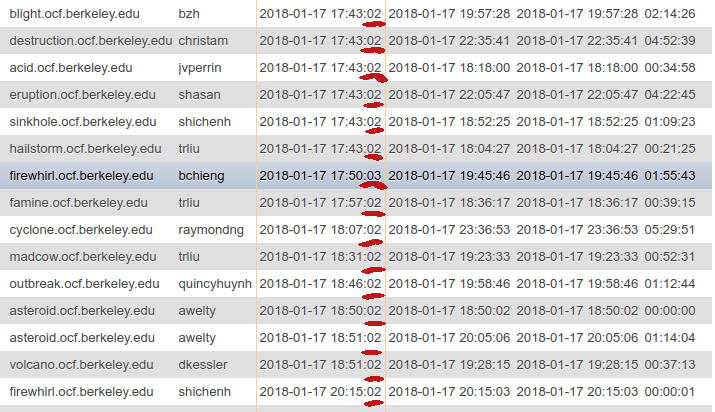 See most of the sessions start at “02.” and the first few session start at the exact same time, which is highly unlikely.
Then I reported this issue in our internal web forum and waited. Our deputy site manager responded that he found a bug in the code (the session tracking script). I asked him for more details in person over the weekend and he fixed it. However, the new desktop usage graph on our website still rarely reached maximum utilization during the day.
I also later found the total number of desktops in the graph was wrong: the system was counting an extra desktop that was no longer in use. This time, our site manager corrected the corresponding records in our system.
Challenge 3: There is a limitation to what data can show you.
It wasn’t until I moved to another project that I found two convincing causes for why the graph was not “right.” My new project was to dynamically display the number of desktops available on the lab TV screen so that a user waiting in line can know in real time whenever a desktop is available. (see below) 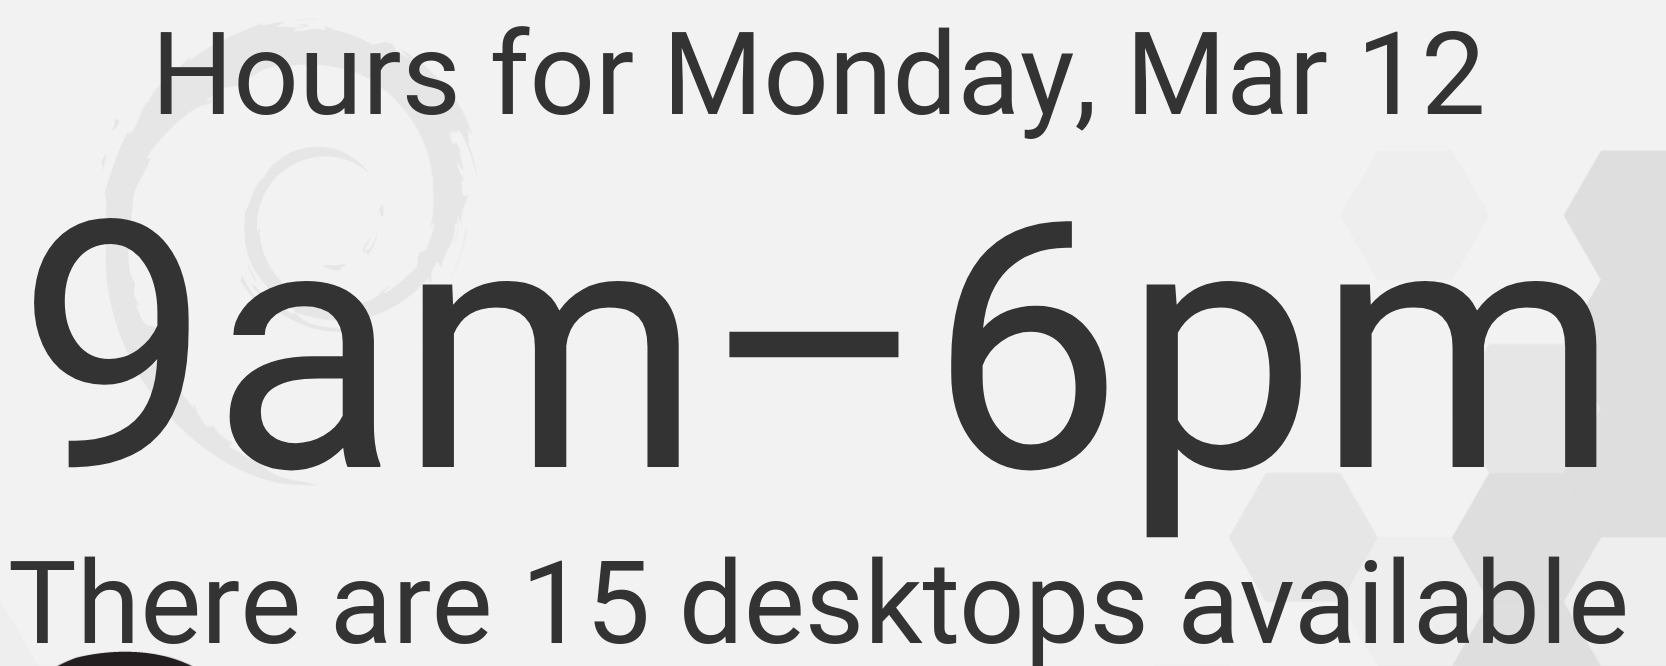
During an afternoon when the lab was full, the TV showed that the number of desktop available was, once again, not 0. I walked around the lab and realized there was one or two people occupied a desktop station but didn’t log into the desktop. Some of them did work with their laptops, while some were creating an OCF account to be able to log in a desktop. In short, we often have full lab utilization (all space occupied) but not desktop utilization (all desktops logged in).
Conclusion:
Here are some things I have learned while working with data on a relatively small organization:
1.Data quality is important, thus data quality documentation is necessary. In my case, we need to let future OCF staff know why many sessions were starting only at the beginning of the minute. We should also specify that some users don’t log into a desktop but still occupy desktop stations.
2.It is nice if you have good engineering skills, otherwise you have to rely on communication with data engineers to work with the data pipelines. In my case, I have to talk to the site managers or more senior staff to learn how the data is collected and wait for them to correct any inconsistencies.
3.Digital data is often not enough, you need to gather as much useful information as possible. In my case, besides our database data, I have lots knowledge about the lab since I am physically in the lab for a long time.
Reference
https://towardsdatascience.com/the-ten-fallacies-of-data-science-9b2af78a1862 https://www.slideshare.net/ChuongTomDo/data-products-in-the-real-world-why-predictive-performance-is-the-least-of-your-problems