Indoor Positioning Research Project
1. Introduction
This project is about finding the location of an indoor device based on the signal strength it receives from 5 access points.
2. Data Description
Below plot is a map on a building floor, each blue point represents a single data point or device. Signal strengths are measured from 5 access points (orange dots) for the devices. The signal strength from the first access point is in the variable S1, and S2 through S5 are similarly defined. The locations of the access points are in the data frame called AP. 
3. Workflow
- researched, then learned about using the differential methods
- implemented a k1 nearest neighbor algorithm, reduced MSE from 17 (from linear regression) to 10
- then tried to implement some differential methods such as
a. regression on dx and dy
b. solving system of equations based on \(\begin{aligned} S = kd + b \quad and \quad d = \sqrt{(x_1 - A_x)^2 + (y_1 - A_y)^2} \end{aligned}\)
where S is the signal strength, d is the distance between the device \((x_1, y_1)\) and the wifi access point \((A_x, A_y)\), k and d are parameters for a linear equation.
- analyzed on the nearest neighbor poor performing points.
4. Signal Strength and Distance
Relationship between Signal Strength and Distance
To accurately locate the device, some algorithms may have to first approximate the distance between the device to the access point from the device’s signal strengths.
Note the following graph, signal strength ranges from -39/40(the best) to -92(the worst). 


Relationship between Distance and Signal Strength


Signal strength overall is negatively correlated with the distance between the access point and the device. However, this seemingly linear relationship becomes very weak after a certain signal strength threshold. Specifically, after the signal strength is low enough, the distance could vary a lot. And this threshold is different for different access point.
Therefore, Bayesian method may be able to take this information into consideration and provide better modeling accuracy.
5. Nearest Neighbor:
Introduction
Comparing to my peers, I decided to use a nearest neighbor algorithm to locate the training data: In this machine learning algorithm, signal strength from all access points serve as features. For each device, I calculate its euclidean distance with all other devices and decide the device’s location based on its closest neighbor.
In a real world setting this maybe a bad approach because the device we try to locate may not be always close to anyone of our training data location. I used this method to achieve the following:
- find some neighbors then use the neighbor’s information to further locate the device.
- confirm that close devices receive similar signal strength
Overall the nearest neighbor logarithm gives significantly better result than my peers’ linear regression (10.97units comparing to 17). The most important thing is, by in large, it actually gives me good close neighbors from signal strength data. Below is a visualization I made. Each small circle represents a device, the arrow from the circle represents its nearest neighbor in signal strengths 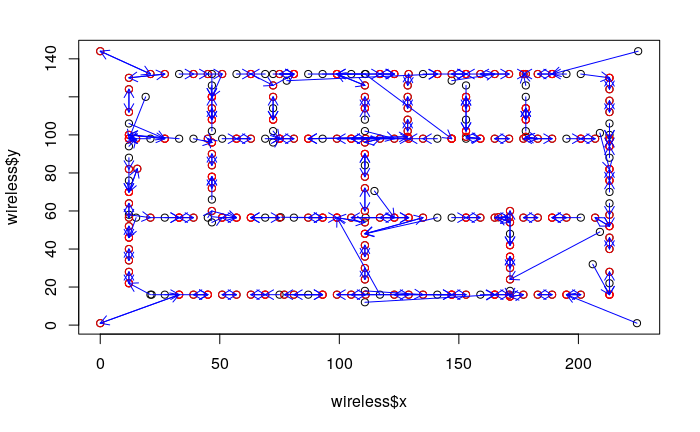
Modified distance function
Another evidence that supports using Bayesian for further development comes from a failed attempt to increase accuracy: I tried using a modified euclidean distance function
\[\begin{aligned} d_{ij} = \sqrt{\Sigma_{k=1}^5 (\frac{1}{S_{ik}} - \frac{1}{S_{jk}})^2} \end{aligned}\]where \(S_{ki}\) means the signal strength of the \(k^{th}\) access point on \(i^{th}\) device (Below is the conventional euclidean distance function for comparison)
\[\begin{aligned} d_{ij} = \sqrt{\Sigma_{k=1}^5 ({S_{ik}} - {S_{jk}})^2} \end{aligned}\]The new distance function decreases the weight of weak signal strengths in the distance between two devices since weaker signal strengths may have more noise(less information) on telling the exact location of a device. However, empirically this approach decreases the nearest neighbor accuracy by introducing more outliers. I think the best way to work around it is to use Bayes like discussed in the previous section.
Error Analysis
Distribution of Errors
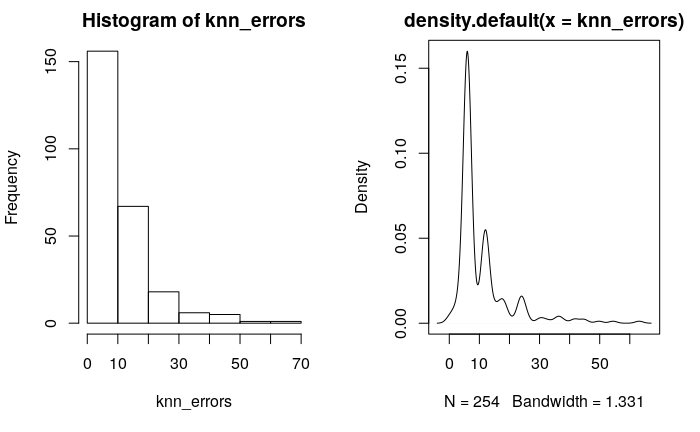
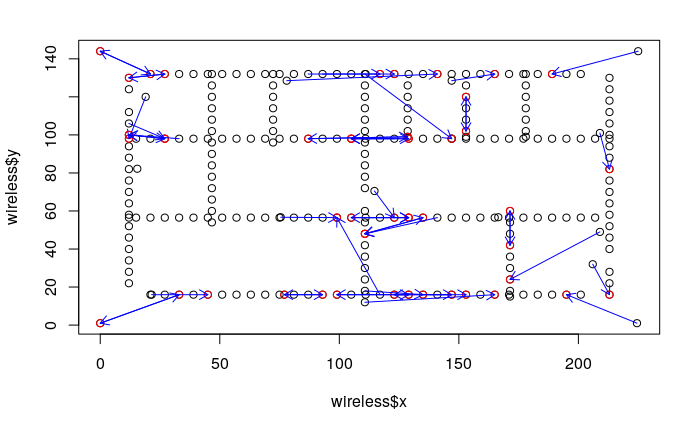
Visualizations of location errors that are more than 15 units.
-
For some reason, big error seems to concentrate in the middle (maybe introducing some noise to each data point would help)
-
Signal point failure
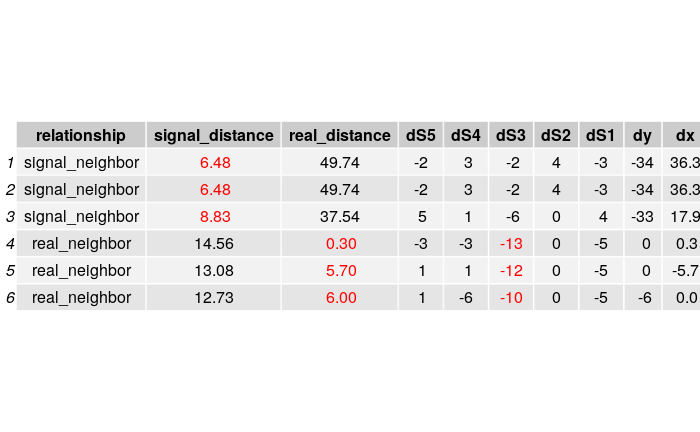
By examining some data points where nearest neighbor algorithm performs poorly, I find that many of them have a “inaccurate” signal strength from a single access point. In other words, those data points’s signal strengths from a single access point is quite different from their neighbors.
Below is are two examples. Each table shows both the top 3 neighbors from a data point in terms of both signal strength distance and real coordinate distance, along with the difference in signal strength and coordinates.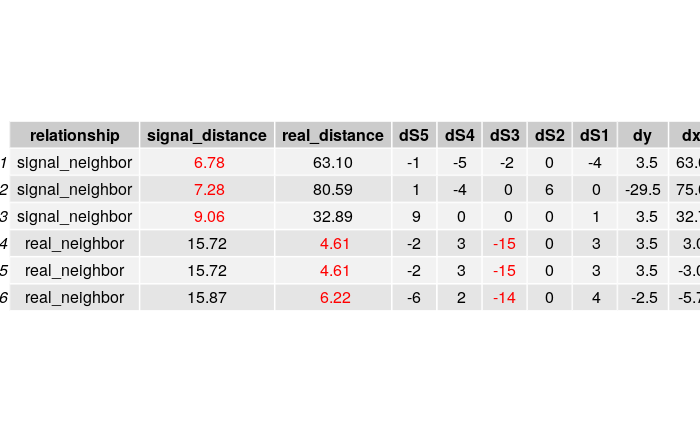
7. Reference
wiki
Chang, N; Rashidzadeh, R; Ahmadi, M (2010). “Robust indoor positioning using differential Wi-Fi access points”. IEEE Transactions on Consumer Electronics. 56 (3): 1860–7. (detailed pdf stored in google drive)
8. Future Directions
- Understanding the scale of the coordinates. Does each unit mean 1 meter in real life. This could be done by comparing past papers.
- Complete the Trilateration algorithm with three nearest neighbors.
- Some mechanisms(maybe Bayesian) to take into consideration different access point have different abilities/confidence to predict distance based on signal strength.
9. Learning and reflections
- I have learned to use plotly, a visualization library. I use it because it can display the signal strengths, coordinates when I hover over a point in the plot.
- An important mistake I made is to do modeling without a decent understanding of the dataset. I spent very little time doing exploratory data analysis. If I have known the noise(the single access point failure), I would not have spent hours thinking about the differential modeling method.
- It is extremely important to think about the noise in your dataset. Noise could have many definitions:
a. known but unchangeable variations such as signal noise
b. unknown variations that you can not explain(such as I don’t know why many failures are in the middle, this may require me to know more about physics or signal processing.)